POPULAR
 Data Interpretation Questions and Answers for Bank PO and SSC
  1798 views
Data Interpretation is an essential part of the Mathematics subject of Quantitative Aptitude. Basically, data interpretation is based on the bar graph, line graph, tabulation,s and pie chart questions. Here are sharing some important questions related to this article.
Data interpretation is an essential part of quantitative aptitude. Basically, data interpretation is a combination topic of the bar graph, line graph, tabulation and pie chart questions. But here I am sharing you, data interpretation questions with solutions related to bar graph and tabulation.
Data interpretation is an essential part of quantitative aptitude. In this data interpretation blog given all the topics like bar graph, line graph, pie chart, table chart.
The above table gives the rainfall (in mm) in a city on 7 days of a certain week. The range of the above data is-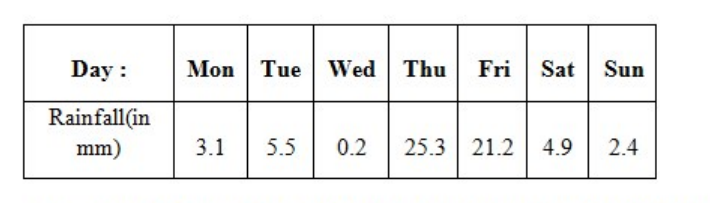
The bar graph shows the number of painting sold an art gallery in each month from January to June.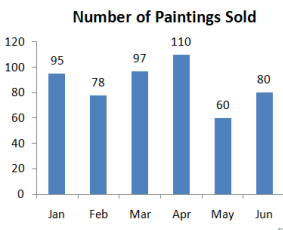
How many paintings does it need to sell in July for the 7 month average to be 90?
749 0 60c09eb2c197293a48276046This line graph shows the scores of a batsman in 6 consecutive matches. What is the range of his scores?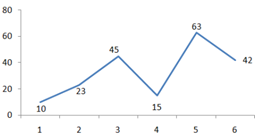
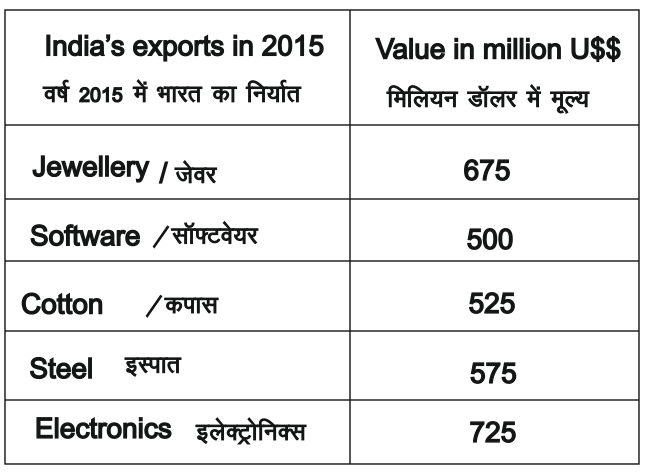
Refer the below data table and answer the following question.
Jewellery was what percent of total exports?