Join Examsbook
Which type of vehicle showed a 32% increase in export in 2015 as compared to that in the previous year?
5Direction: The given Bar Graph Presents the number of different types of vehicles (in lakhs) exported by a company during 2014 and 2015.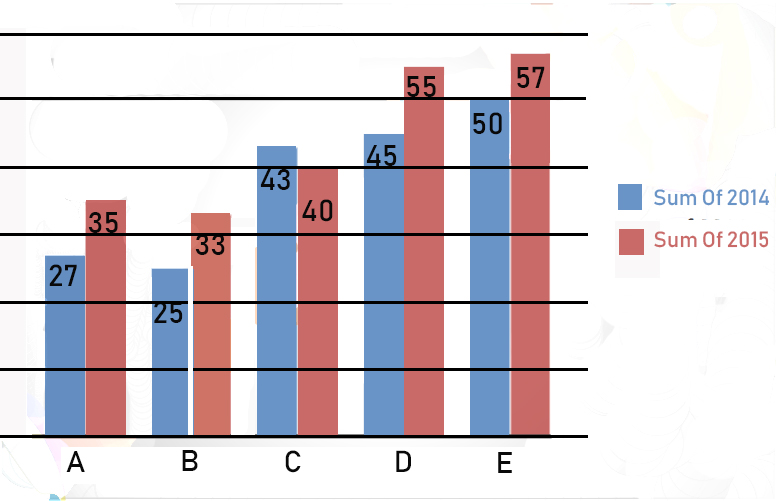
Q:
Which type of vehicle showed a 32% increase in export in 2015 as compared to that in the previous year?
- 1Btrue
- 2Afalse
- 3Efalse
- 4Dfalse
- Show AnswerHide Answer
- Workspace