Join Examsbook
Which student sold the least tickets?
5Directions: The bar graph, given here, shows the number of tickets sold by 6 students A, B, C, D, E and F during a fair. 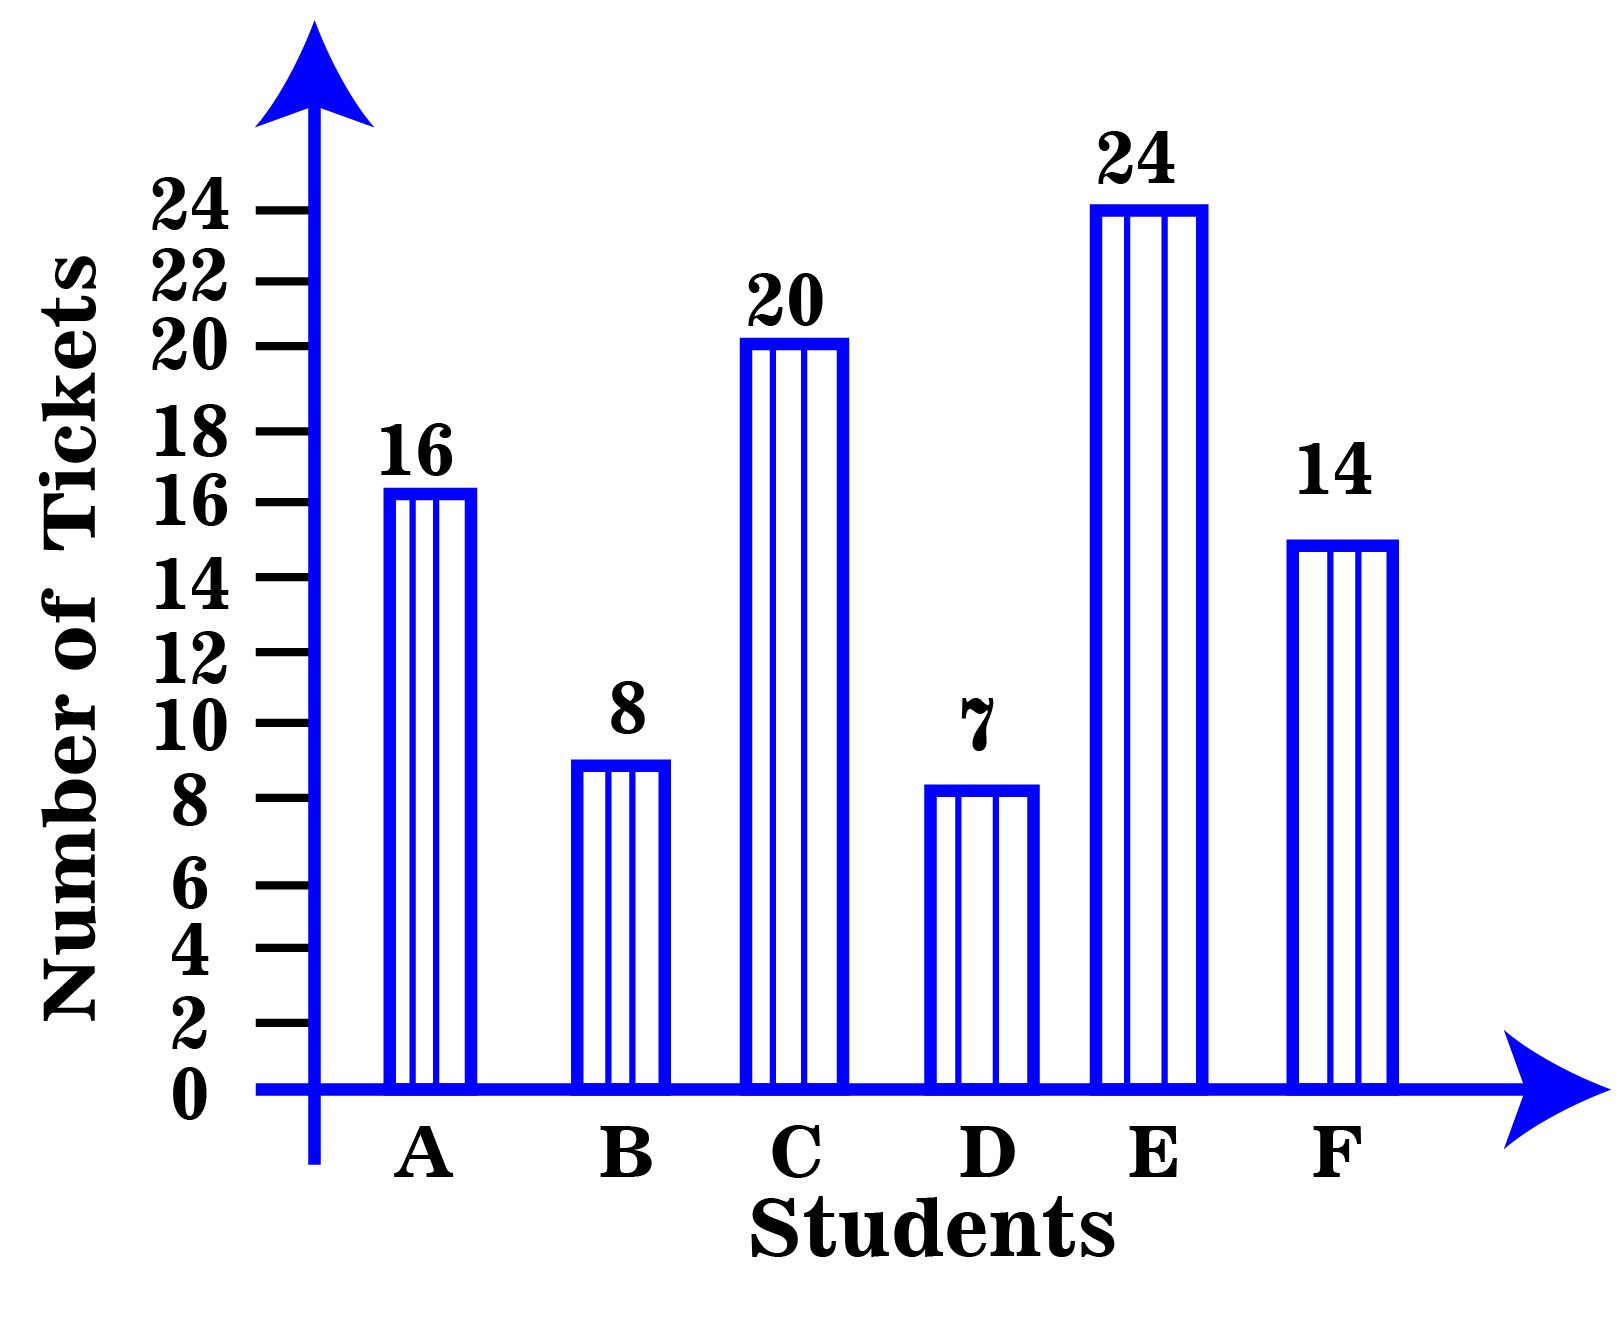
Q:
Which student sold the least tickets?
- 1Bfalse
- 2Ffalse
- 3Afalse
- 4Dtrue
- 5None of thesefalse
- Show AnswerHide Answer
- Workspace