Join Examsbook
What is the ratio of sum of expenditure in the year 2012 and 2013 to that of revenue in year 2014?
5Directions: Answer the questions based on the information given below:
The following line graph shows revenue and expenditure of company A for 5 years (in Lakhs):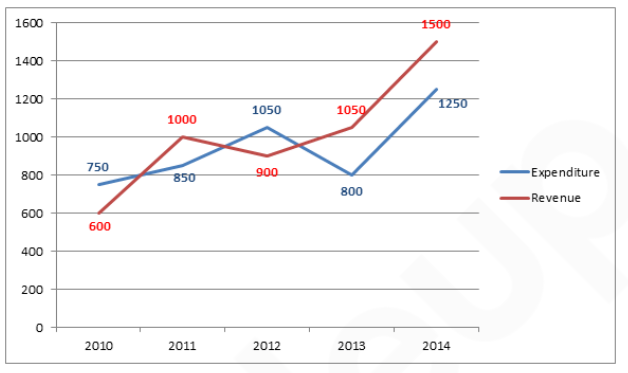
Q:
What is the ratio of sum of expenditure in the year 2012 and 2013 to that of revenue in year 2014?
- 130: 37false
- 237: 30true
- 321: 25false
- 425: 21false
- 5None of thesefalse
- Show AnswerHide Answer
- Workspace