Join Examsbook
What is the ratio of companies with high demand to production and companies with less than production?
5Directions : The graph shows the demand and production of different companies. Study the graph and answer the following questions.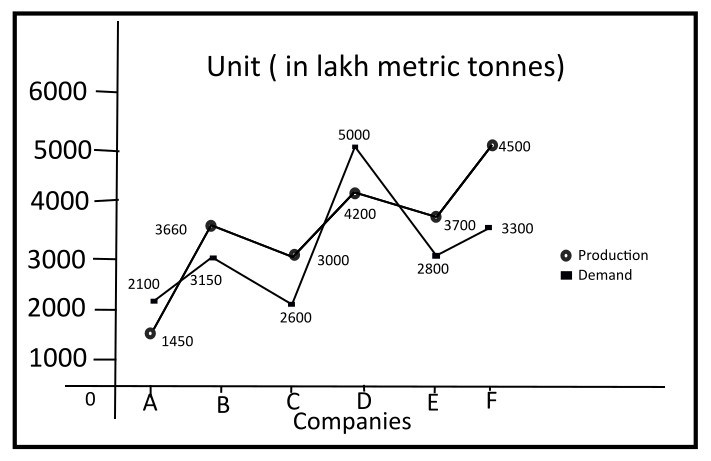
Q:
What is the ratio of companies with high demand to production and companies with less than production?
- 11:2true
- 22:3false
- 32:1false
- 43:2false
- Show AnswerHide Answer
- Workspace