Join Examsbook
What approx. percentage of average money spend by Sunil on food to that of average money saved by him during all these years if his salary per annum was ₹ 5,00,000
5Directions: The following bar graph shows the percentage breakup of a Sunil’s salary from year 2012 to 2016. With the given information, find the following questions.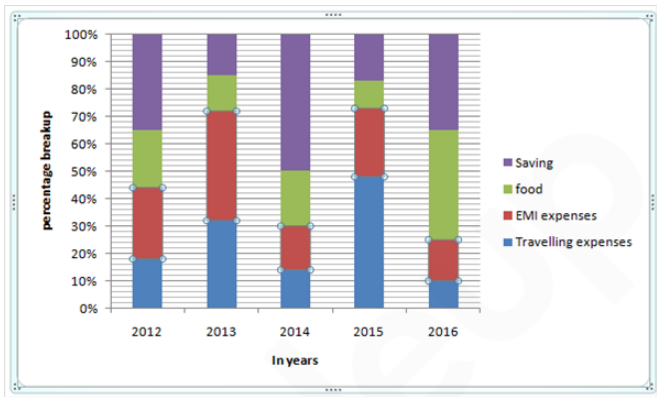
Q:
What approx. percentage of average money spend by Sunil on food to that of average money saved by him during all these years if his salary per annum was ₹ 5,00,000
- 169%false
- 266%false
- 365%false
- 470%false
- 568%true
- Show AnswerHide Answer
- Workspace