Join Examsbook
The total number of type B, D and E vehicles exported in 2014 is what percentage of the total number of type A, C, D and E vehicles exported in 2015 (correct to one decimal place)?
5Direction: The given Bar Graph Presents the number of different types of vehicles (in lakhs) exported by a company during 2014 and 2015.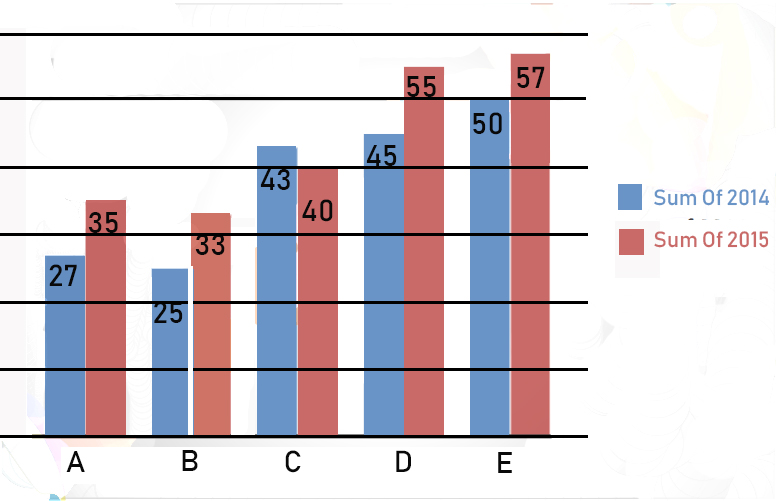
Q:
The total number of type B, D and E vehicles exported in 2014 is what percentage of the total number of type A, C, D and E vehicles exported in 2015 (correct to one decimal place)?
- 163.8%false
- 264.2%true
- 362.4%false
- 461.6%false
- Show AnswerHide Answer
- Workspace