Join Examsbook
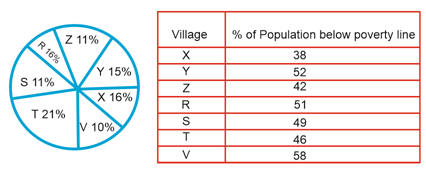
Direction: The following pie chart shows proportion of the population of seven villages n 2009. Study the pie chart and answer question that follows:
The ratio of the below poverty line population of village ‘T’ to that of the below poverty line population of village ‘Z’ is
 5
5
Q: Direction: The following pie chart shows proportion of the population of seven villages n 2009. Study the pie chart and answer question that follows:
The ratio of the below poverty line population of village ‘T’ to that of the below poverty line population of village ‘Z’ is
5 Q: Direction: The following pie chart shows proportion of the population of seven villages n 2009. Study the pie chart and answer question that follows:
The ratio of the below poverty line population of village ‘T’ to that of the below poverty line population of village ‘Z’ is
- 111:23false
- 213:11false
- 323:11true
- 411:13false
- Show AnswerHide Answer
- Workspace