Join Examsbook
The percent of income spent on clothing exceeds that on savings by :
5Directions: The bar graph given below shows the spending of family income on various items and savings during 1993. Observe the graph and answer the following questions: 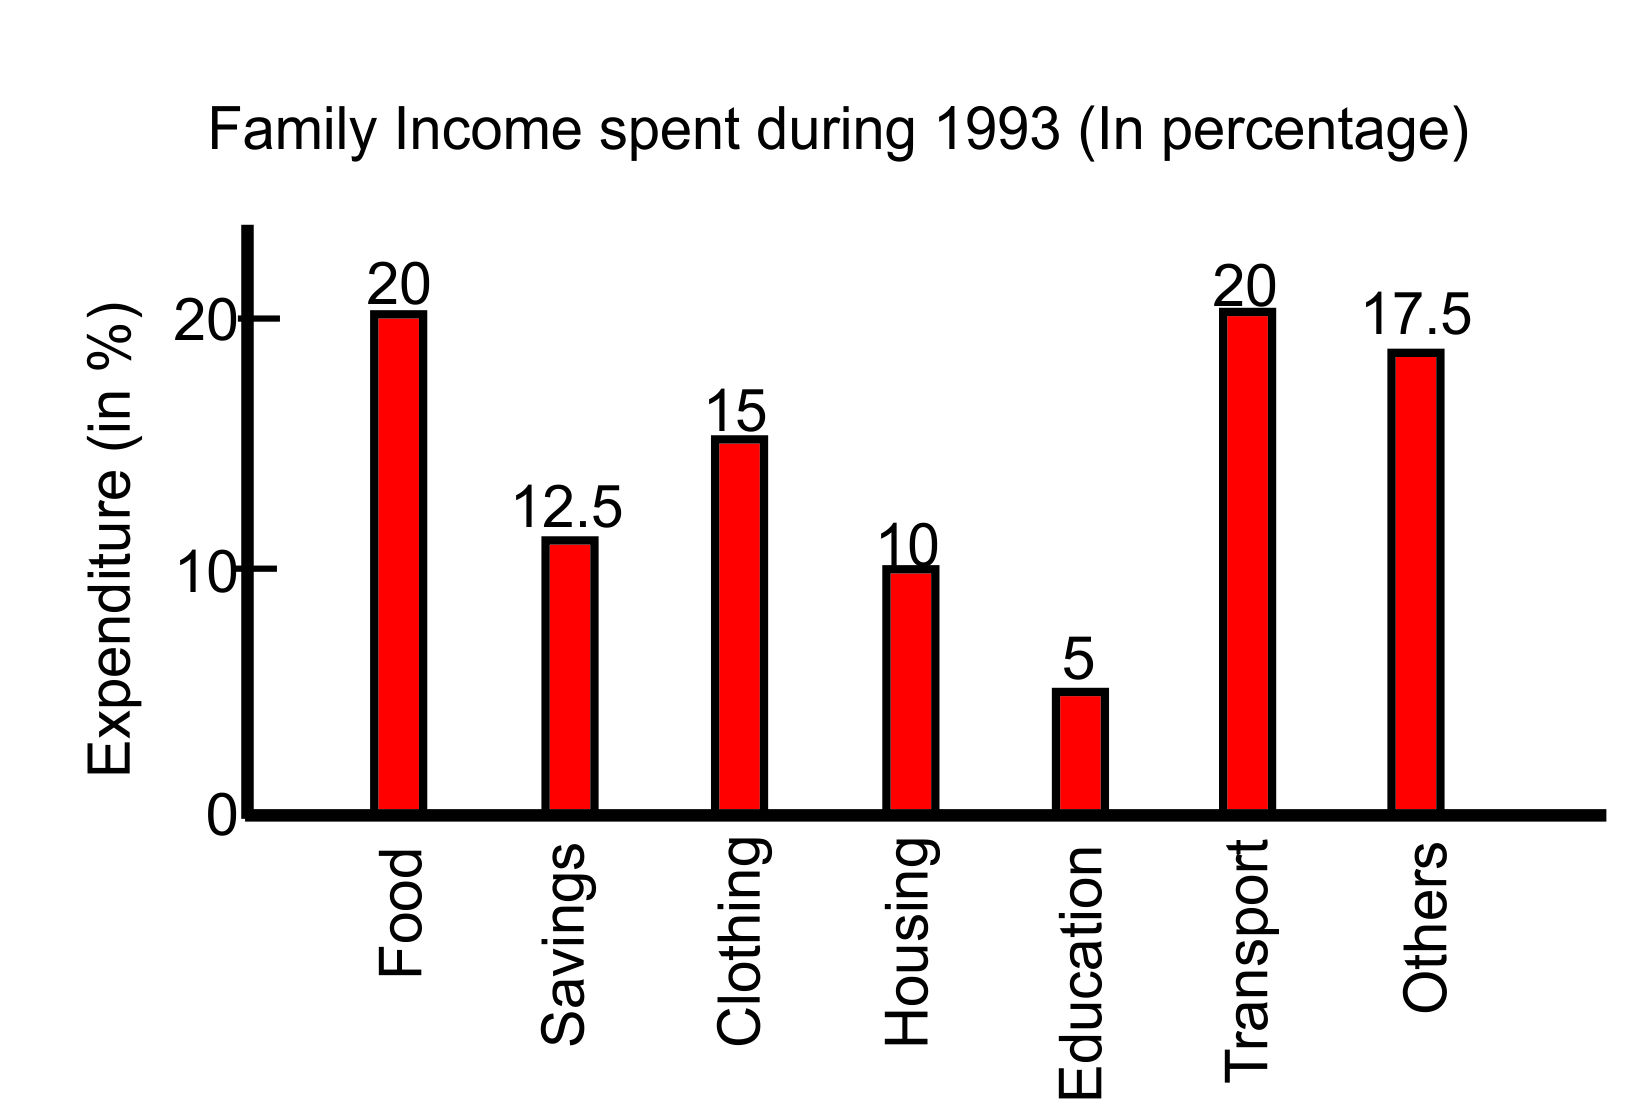
Q:
The percent of income spent on clothing exceeds that on savings by :
- 112.5 %false
- 22.5 %true
- 310%false
- 422.5 %false
- Show AnswerHide Answer
- Workspace