Join Examsbook
Out of total pens sold on Tuesday ratio between total defective pens sold to total pens sold is 7 : 15. Find total number of non-defective pens sold on Tuesday by retailer?
5Directions: Bar graph given below shows pens sold by a retailor on five different days. Study the data carefully and answer the following questions. 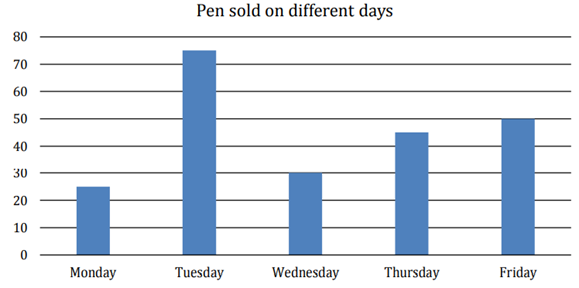
Q:
Out of total pens sold on Tuesday ratio between total defective pens sold to total pens sold is 7 : 15. Find total number of non-defective pens sold on Tuesday by retailer?
- 120false
- 225false
- 330false
- 435false
- 540true
- Show AnswerHide Answer
- Workspace