Join Examsbook
Out of the total number of products sold by A and B together in 2011, only 20% are defected. What is the total number of defected products sold by A and B together in 2011?
5Directions :- Refer the graph and answer the given questions.
The following line graph shows the number of products sold by company A and B during six years.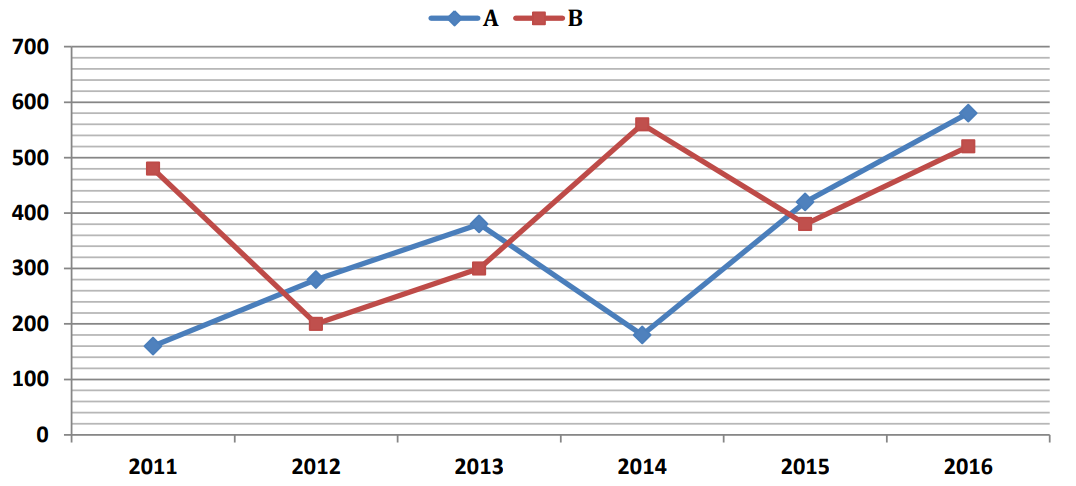
Q:
Out of the total number of products sold by A and B together in 2011, only 20% are defected. What is the total number of defected products sold by A and B together in 2011?
- 1228false
- 2128true
- 3160false
- 4148false
- 5138false
- Show AnswerHide Answer
- Workspace