Join Examsbook
In which census year, the percent increase in population is least as compared to that in the previous census year?
5Directions: The Bar Graph given here shows the population (in crores) of India in various census years. Observe the graph and answer the question based on it. 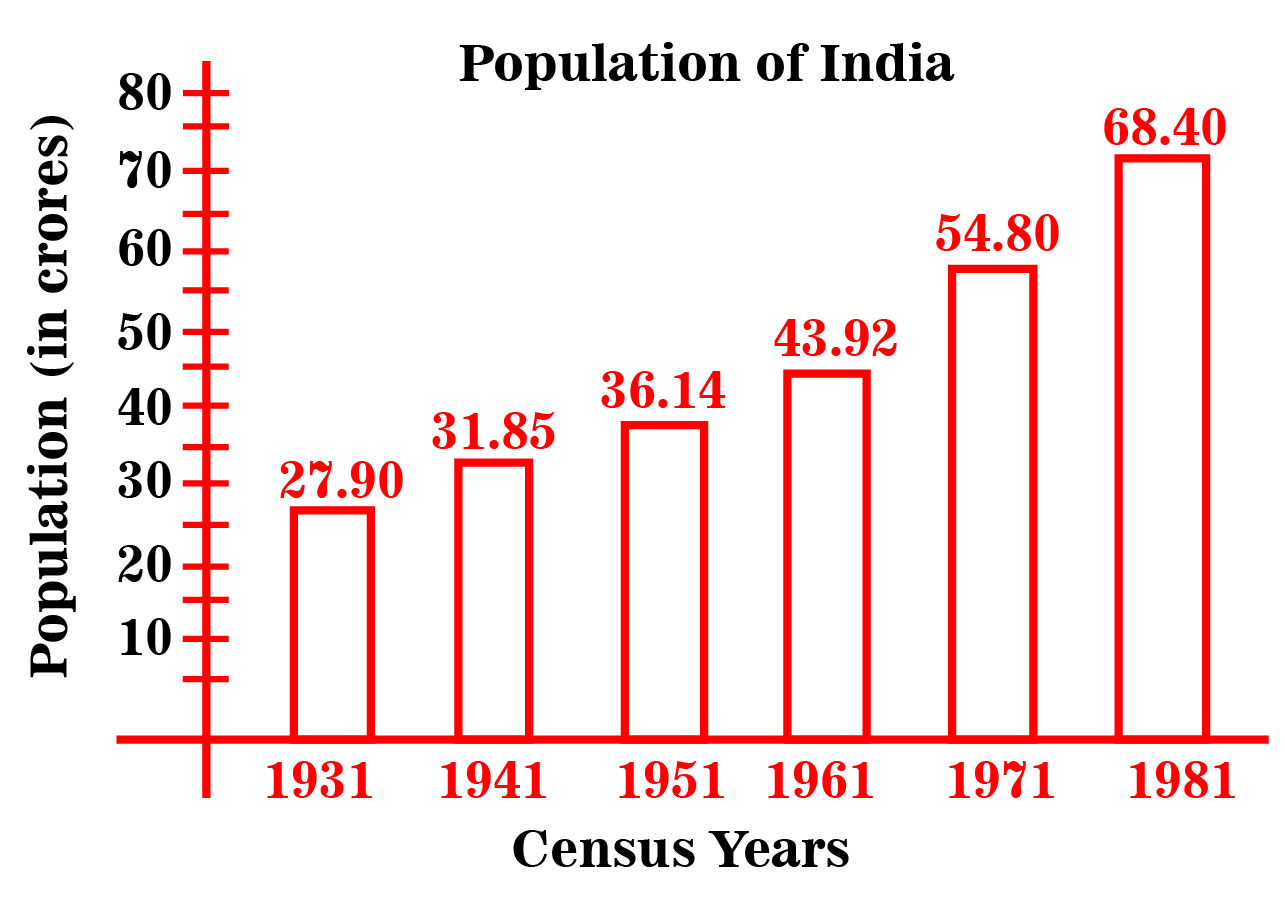
Q:
In which census year, the percent increase in population is least as compared to that in the previous census year?
- 11961false
- 21951true
- 31971false
- 41941false
- 5None of thesefalse
- Show AnswerHide Answer
- Workspace