Join Examsbook
If the saving in 2012 is 4/5th of the saving in 2014. Then what is the total expenditure spent on food in 2012? (Given that total expense in 2014 is ₹ 1,85,000)
5Directions: The following bar graph shows the percentage breakup of a Sunil’s salary from year 2012 to 2016. With the given information, find the following questions.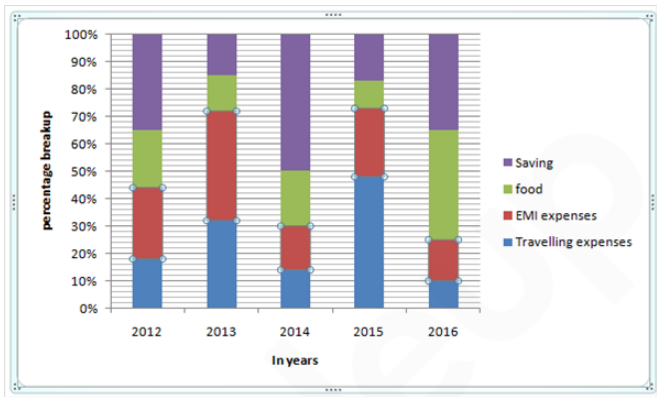
Q:
If the saving in 2012 is 4/5th of the saving in 2014. Then what is the total expenditure spent on food in 2012? (Given that total expense in 2014 is ₹ 1,85,000)
- 1₹ 21,100false
- 2₹ 45,100false
- 3₹ 40,400false
- 4₹ 44,400true
- 5None of thesefalse
- Show AnswerHide Answer
- Workspace