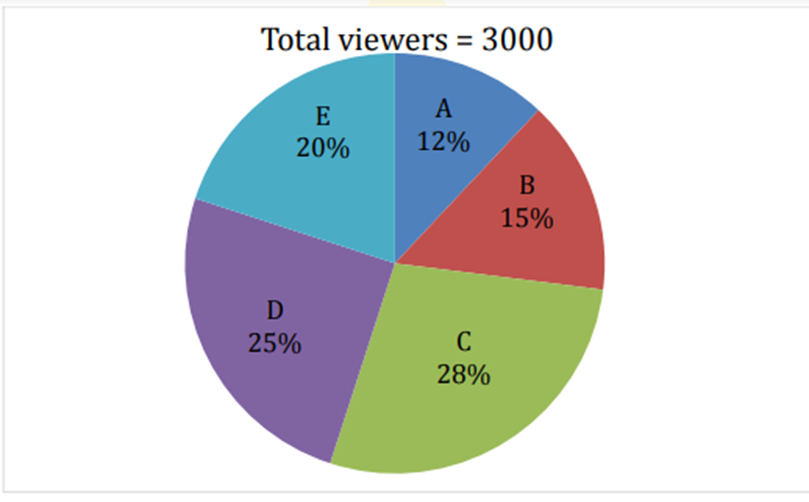
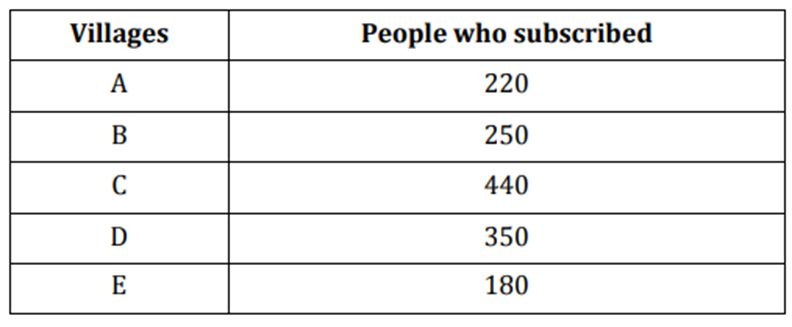
If the above data given for the year 2017 and in 2018 total viewers increased by 40%, while percentage distribution of viewers of TV channel in five different villages remain same as in 2017. If number of subscribed viewers from village A, B, D & E in 2018 increased by 25%, 20%, 14% & 10% respectively and total subscribed viewer from all the five village in 2018 are 1400, then find total unsubscribed viewers from C in 2018?
5Direction : Given pie chart shows percentage distribution of viewers of a Tv channel in five different villages (A, B, C, D & E) and table shows number of viewers who subscribed the channel. Read the data carefully and answer the questions.
Note – Total viewers = Total subscriber + Total unsubscriber
Q:
If the above data given for the year 2017 and in 2018 total viewers increased by 40%, while percentage distribution of viewers of TV channel in five different villages remain same as in 2017. If number of subscribed viewers from village A, B, D & E in 2018 increased by 25%, 20%, 14% & 10% respectively and total subscribed viewer from all the five village in 2018 are 1400, then find total unsubscribed viewers from C in 2018?
- 1942false
- 2952false
- 3948true
- 4956false
- 5964false
- Show AnswerHide Answer
- Workspace