Join Examsbook
Graph shows that the maximum amount was spent on
5Pie chart shows the percent of money spent by family on various item during 1999. Study the graph and answer these questions.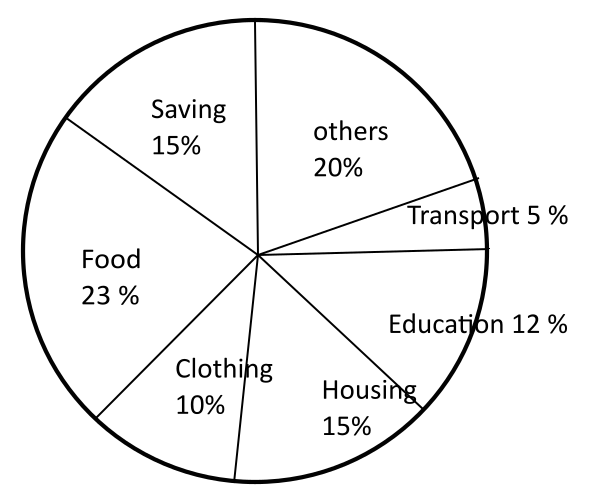
Q:
Graph shows that the maximum amount was spent on
- 1Foodtrue
- 2Clothingfalse
- 3Housingfalse
- 4Othersfalse
- Show AnswerHide Answer
- Workspace