Join Examsbook
Find the ratio between the total number of units sold in 2013 and 2015 and the number of units produced in 2015 and 2016?
5The following table shows the number of units of product produced and sold by a company over the course of six years.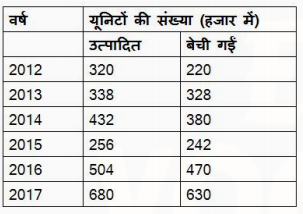
Q:
Find the ratio between the total number of units sold in 2013 and 2015 and the number of units produced in 2015 and 2016?
- 114 : 19false
- 229 : 38false
- 33 : 4true
- 47 : 9false
- Show AnswerHide Answer
- Workspace