Join Examsbook
Between which two years is the rate of decrement in vacancies is maximum?
5The line graph shows the number of vacancies of accountants in a certain company. Study the diagram and answer the following questions.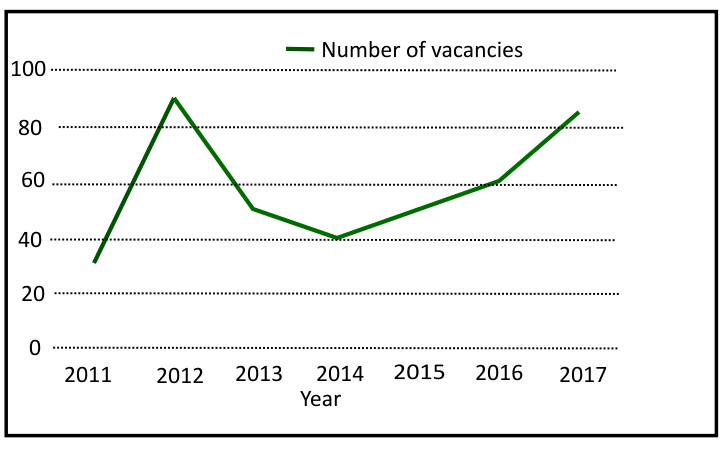
Q:
Between which two years is the rate of decrement in vacancies is maximum?
- 12013-2014false
- 22012-2015false
- 32012-2014false
- 42012-2013true
- Show AnswerHide Answer
- Workspace