Join Examsbook
Average number of Women working in 2014, 2015 and 2016 together is how much more/less than average number of Men working in 2011, 2014 and 2016 together?
5Direction: The line chart given below shows the number of labors (men and women) working in six different years. Study the data carefully and answer the following questions.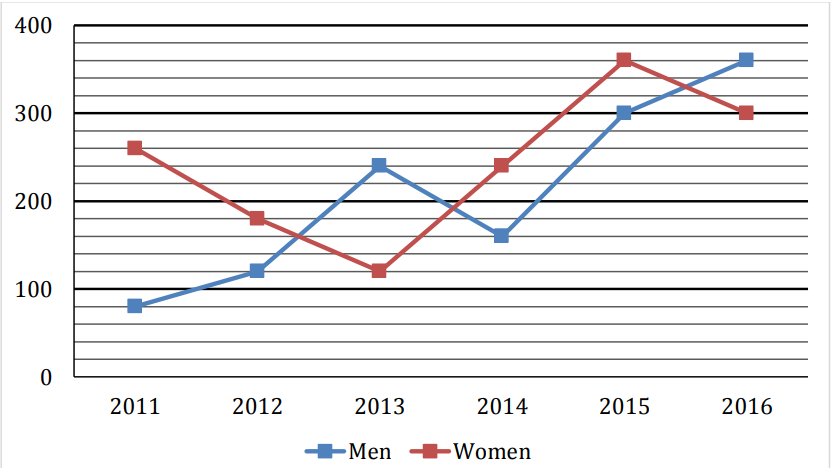
Q:
Average number of Women working in 2014, 2015 and 2016 together is how much more/less than average number of Men working in 2011, 2014 and 2016 together?
- 190false
- 270false
- 3100true
- 480false
- 5None of the given optionsfalse
- Show AnswerHide Answer
- Workspace