POPULAR
 Logical Venn Diagrams Questions for SSC or Bank Exams
  2146 views
Logical Venn diagram is a very important topic in the verbal reasoning section. It's a process of showing the complex relationship between 2–3 categories as a diagram through various geometric structures. In the banking, railway, SSC exams, questions are asked about Logic Venn Diagram in the Verbal reasoning section which are 3-4 questions in question-paper.
Here are complete detail of logical venn diagram topics for those students who are preparing for the competitive exams. This topic related to reasoning section. Here students easily understand this topic through venn diagram types, problems and their solutions also by the different-2 examples.
Logical venn diagrams questions are most important questions for all competitive exams. These logical venn diagram questions mostly asked in SSC, Bank exams.
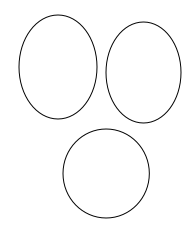
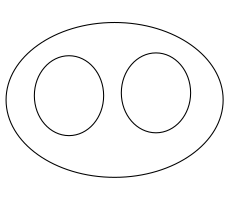
Which of the following diagrams represents smokers, lawyers, non-smokers ?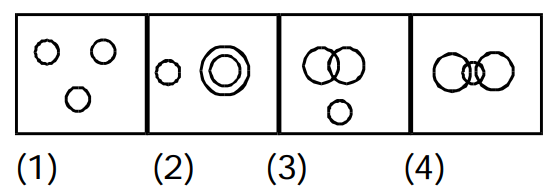
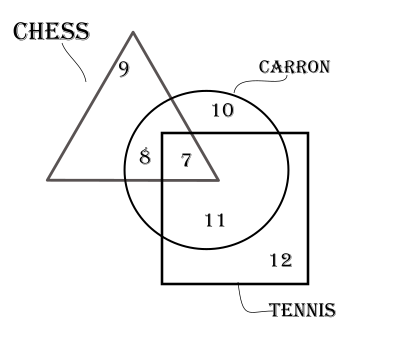
An interview of 60 persons to know whether they play Tennis Chess or Carrom was conducted . The data so obtained has been summarized in a pictorial diagram as shown. Study the diagram and answer the question, how many persons do not play any game?
Which Venn diagram best represents the given set of classes?
Married persons, government employees, teachers
620 0 6114f16a56340c207008634e

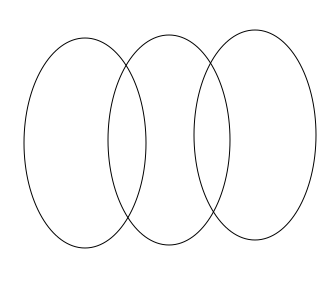
Select the Venn diagram that best illustrates the relationship between the three given classes.
School, Teacher, Student


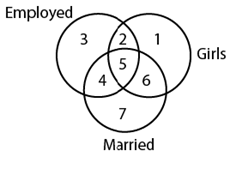
Study the diagram below and identify the region representing girls who are employed but unmarried.